Lesson 9 — Fulfillment KPIs (OTIF, DOT, FOT, DIF)
Every fulfillment operation generates data — but only a few numbers truly reflect performance. These are your KPIs: the signals that tell you whether your fulfillment system is reliable, predictable, and meeting customer expectations.
This lesson explains the difference between metrics and KPIs, introduces the four most important fulfillment KPIs, shows how to interpret them, and explains how FillSpeed tracks them over time to reveal the true health of your operation.
1. Metrics vs. KPIs: What’s the Difference?
Metrics = Activity
Metrics describe what happened.
Examples:
- number of orders received
- number of orders fulfilled
- cycle time
- average cycle time
- WIP (work in progress)
Metrics are raw signals. They show volume and movement.
KPIs = Performance
KPIs describe how well you performed relative to expectations or promises.
Examples:
- FOT (Fulfilled On Time)
- DOT (Delivered On Time)
- DIF (Delivered In Full)
- OTIF (On Time In Full)
KPIs measure reliability, accuracy, and consistency — the things customers feel.
Metrics show activity.
KPIs show quality.
2. The Four Core Fulfillment KPIs
These KPIs are used across the global supply chain industry — from Shopify merchants to the largest retailers and 3PLs.
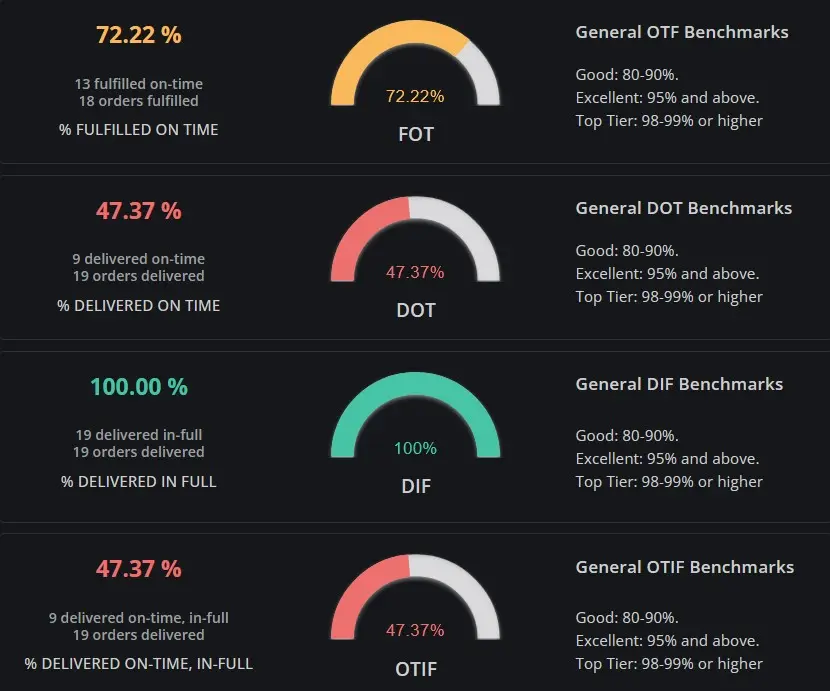
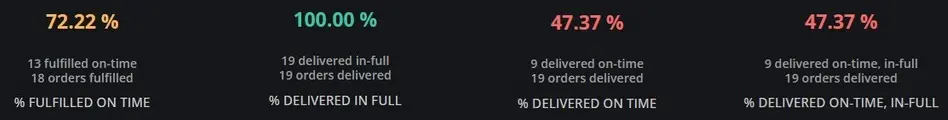
1. FOT — Fulfilled On Time
Definition:
The percentage of orders fulfilled (picked, packed, and handed to the carrier) by the promised ship‑by time.
Goal:
95%+ for stable operations
98%+ for high‑performing merchants
Why it matters:
This is the KPI the merchant fully controls.
If FOT drops, the delivery promise is at risk before the carrier even touches the package.
2. DOT — Delivered On Time
Definition:
The percentage of orders delivered to the customer by the promised delivery date.
Goal:
90%+ for most merchants
95%+ for top performers
Why it matters:
This is the KPI customers care about most.
DOT reflects both merchant performance and carrier performance.
3. DIF — Delivered In Full
Definition:
The percentage of orders delivered with the correct items and quantities.
Goal:
99%+ for all merchants
99.5%+ for top performers
Why it matters:
Accuracy is as important as speed.
A fast but incorrect delivery still damages trust.
4. OTIF — On Time In Full
Definition:
The percentage of orders delivered both on time and in full.
Goal:
85%+ for growing merchants
90%+ for mature operations
95%+ for elite fulfillment teams
Why it matters:
OTIF is the ultimate fulfillment KPI.
If an order is late OR incomplete, it fails OTIF.
This is the KPI that most directly predicts customer satisfaction and repeat business.
3. KPI Benchmarks of Successful Merchants
High‑performing e‑commerce brands typically achieve:
- FOT: 97–99%
- DOT: 93–97%
- DIF: 99–99.7%
- OTIF: 90–95%
These merchants:
- monitor cycle time continuously
- maintain low WIP
- avoid batching
- meet carrier pickup windows
- manage inventory accuracy tightly
- track KPIs daily, not monthly
Their secret is not perfection — it’s visibility and consistency.
4. Why These KPIs Matter
These KPIs directly affect:
Customer Satisfaction
- Late or incorrect deliveries are the #1 driver of negative reviews.
- 69% of customers won’t shop again after a late delivery.
- DIF failures destroy trust instantly.
Retention
- Every extra day in fulfillment reduces repeat purchase probability by 12–18%.
- OTIF is strongly correlated with customer loyalty.
Operational Cost
- Low FOT → overtime, rework, backlog
- Low DIF → returns, reships, support tickets
- Low DOT → refunds, cancellations
Brand Reputation
Customers don’t distinguish between merchant and carrier failures.
They only see whether the promise was kept.
5. How to Interpret These KPIs
KPIs are not just numbers — they are signals.
FOT drops → internal delays
- pick/pack bottlenecks
- staffing issues
- batching behavior
- inventory problems
DOT drops → carrier delays or missed pickups
- late handoffs
- pre‑transit delays
- in‑transit slowdowns
- out‑for‑delivery failures
DIF drops → accuracy issues
- picking errors
- packing errors
- inventory mismatches
OTIF drops → customer trust at risk
- even one weak link breaks the chain
- OTIF is the most sensitive KPI
- OTIF is the most customer‑visible KPI
KPIs must be interpreted in context — and over time.
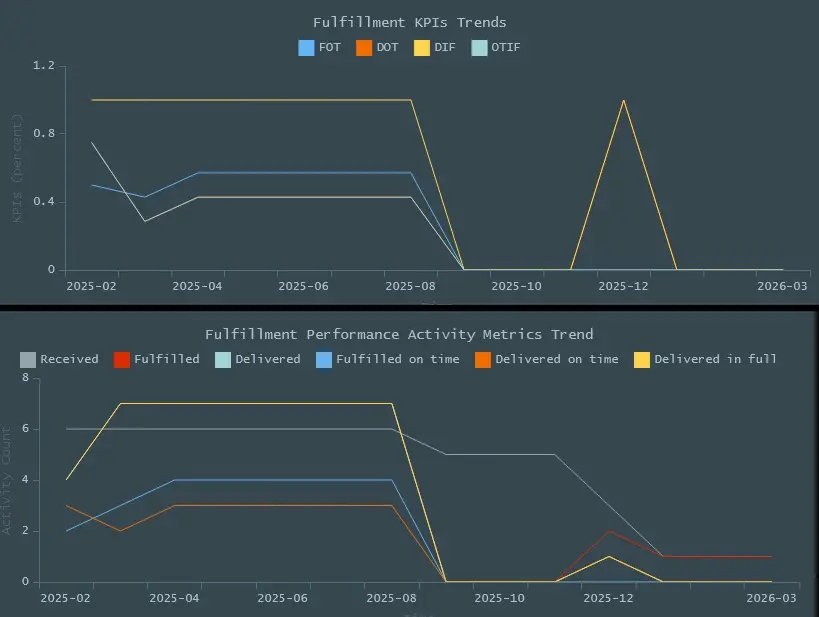
6. Why KPI Trends Matter More Than Single Values
A single KPI value is a snapshot.
A time series is a story.
Trendlines reveal:
- stability
- drift
- seasonality
- bottleneck formation
- recovery
- operational stress
- carrier performance changes
Examples:
- FOT trending downward → internal cycle time rising
- DOT trending downward → carrier issues or missed pickups
- DIF trending downward → accuracy or inventory issues
- OTIF trending downward → customer experience at risk
KPIs must be monitored continuously — not quarterly.
7. FillSpeed Tracks KPIs and Cumulative Averages Over Time
FillSpeed automatically tracks KPIs over time:
- FOT
- DOT
- DIF
- OTIF
FillSpeed also tracks cumulative averages over time:
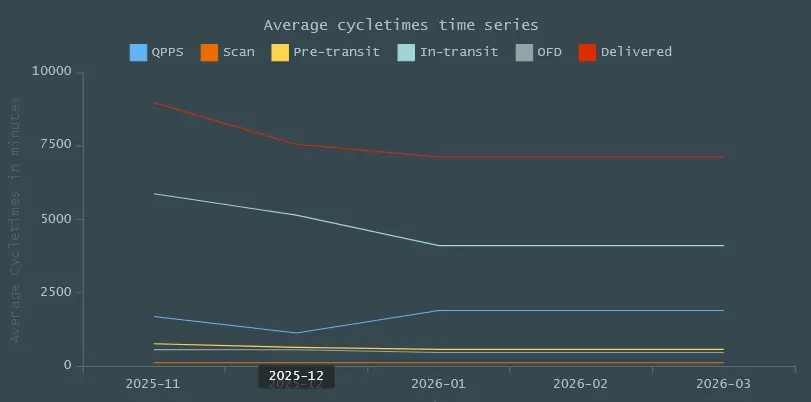
- cumulative averages for each KPI
- daily, weekly, and monthly trends
- variance from baseline
- correlations with cycle time
- correlations with carrier performance
FillSpeed turns KPIs into operational intelligence, not just numbers.
What FillSpeed reveals:
- whether internal delays are rising
- whether carriers are slowing down
- whether accuracy is slipping
- whether delivery promises are at risk
- whether flow is stable or unstable
- whether customer trust is strengthening or weakening
FillSpeed gives Shopify merchants the same KPI visibility that large e‑commerce companies rely on.
8. Want to Learn More About KPIs?
There are many more KPIs used across supply chain and logistics.
For deeper exploration, you can reference industry resources such as:
- Shopify: What is OTIF? How to Achieve On-Time, In-Full Fulfillment
- ASCM (Association for Supply Chain Management
- The 10 Essential KPIs for Supply Chain
- Gartner Supply Chain KPI Frameworks
But for fulfillment operations, the four KPIs in this lesson — FOT, DOT, DIF, OTIF — are the foundation.
Why This Lesson Matters
KPIs translate operational performance into customer experience.
They show whether your fulfillment system is:
- fast
- accurate
- reliable
- predictable
- trustworthy
FillSpeed tracks these KPIs continuously, giving merchants the visibility they need to protect customer trust and scale with confidence.