Lesson 8 — Fulfillment Flow Patterns with Cumulative Flow Charts
Cumulative Flow Diagrams (CFDs) are one of the most powerful tools in flow management. They show how work enters, moves through, and exits your system — revealing bottlenecks, WIP buildup, throughput limits, and flow stability.
This lesson explains what CFDs are, how FillSpeed uses them, and how to interpret the shapes and gaps that define your fulfillment health.
1. What Is a Cumulative Flow Diagram?
A CFD shows:
- how many orders entered each stage
- how many orders left each stage
- how many orders are currently in each stage (WIP)
- how flow changes over time
It is the clearest visualization of flow stability.
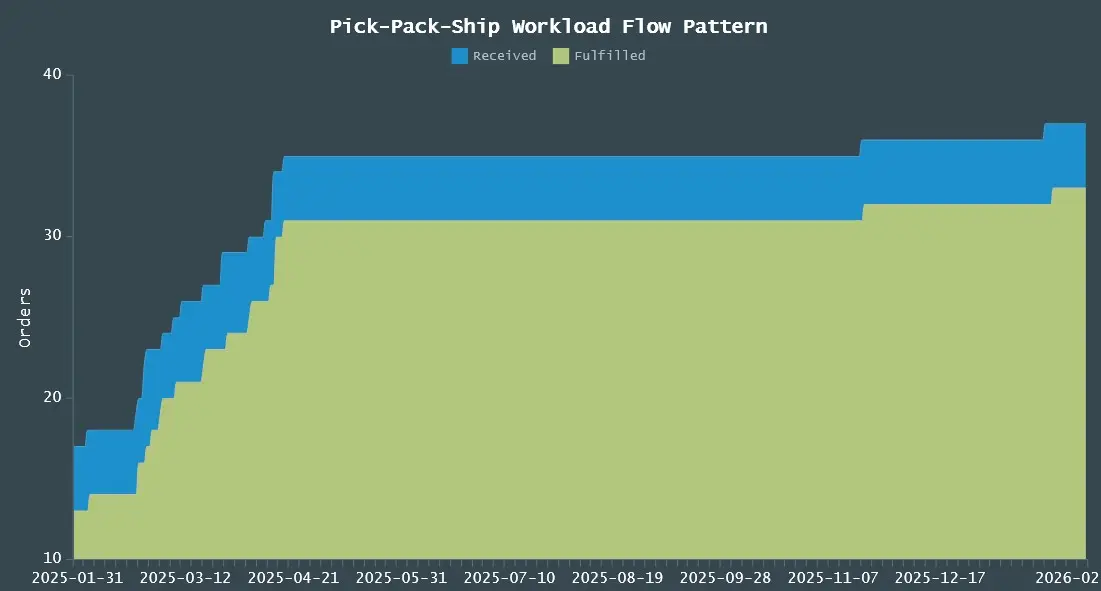
2. Flow Patterns: Orders Received vs. Orders Fulfilled
A CFD plots two essential flows:
1. Orders Received (Arrival Rate)
How fast orders come into the system.
2. Orders Fulfilled (Completion Rate)
How fast orders leave the system.
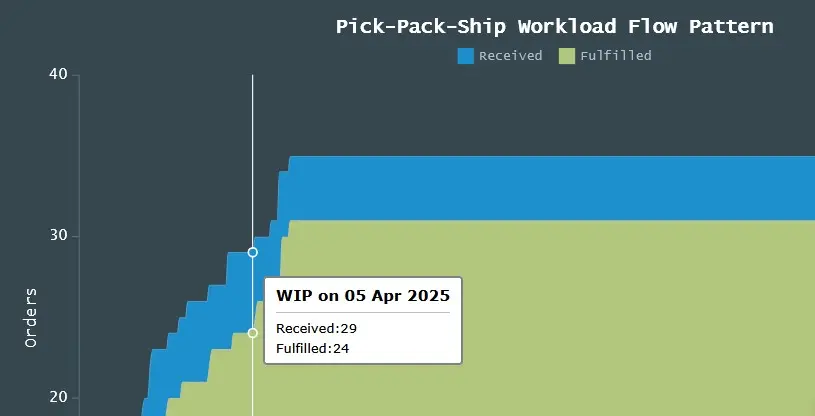
The gap between the two = WIP
- If arrival > completion → WIP grows → bottleneck
- If completion > arrival → WIP shrinks → recovery
This gap is the heartbeat of your operation.
3. WIP (Work in Progress): The Heart of Flow
WIP is the number of orders currently in the system.
- High WIP = slow flow, long cycle times, operator stress
- Low WIP = smooth flow, predictable cycle times
WIP is the single best indicator of flow stability.
4. Throughput: How Much Work You Actually Complete
Throughput is the number of orders completed per unit time.
Throughput is limited by your slowest stage — the bottleneck.
Throughput determines:
- how fast you can recover from spikes
- how stable your flow is
- how predictable your cycle time is
5. Little’s Law: The Fulfillment Equation
Little’s Law states:
WIP = Throughput × Cycle Time
This means:
- If WIP rises, cycle time rises
- If cycle time rises, throughput falls
- If throughput falls, WIP rises
This is the cycle of instability — and the CFD shows it clearly.
6. CFD Shapes and What They Mean
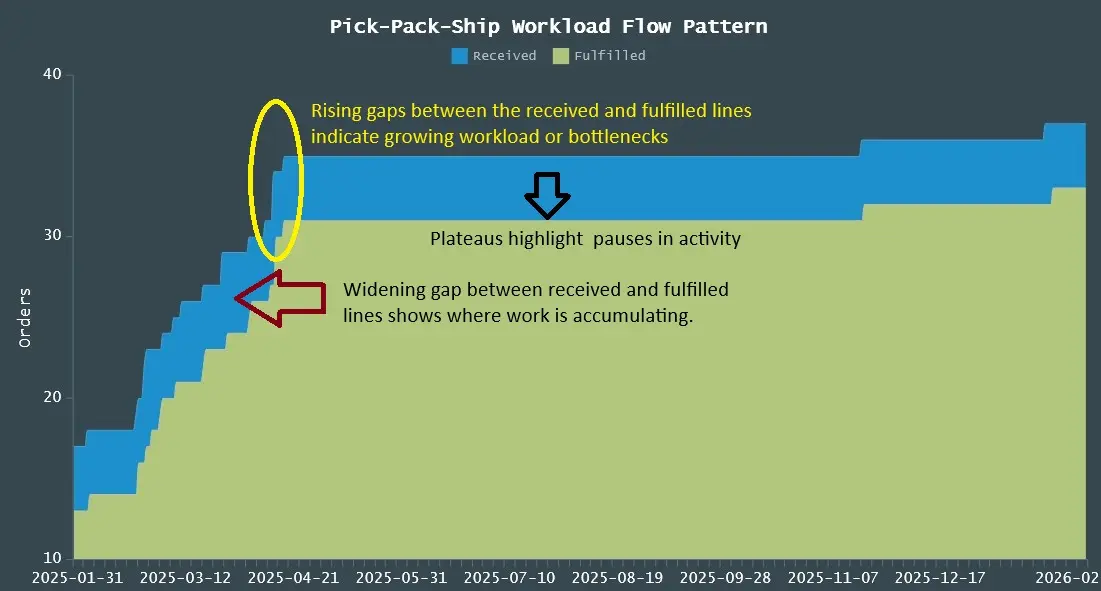
Flat Bands → Stable Flow
Arrival and completion are balanced.
Widening Bands → Bottlenecks Forming
WIP is growing. Flow is slowing.
Narrowing Bands → Recovery
WIP is shrinking. Flow is improving.
Sudden Spikes → Operational Shock
A surge in orders or a breakdown in a stage.
Long Tails → Aging Orders
Orders stuck in the system for too long.
Each shape tells a story about your operation.
7. Why This Lesson Matters
CFDs show:
- flow stability
- bottlenecks
- WIP buildup
- throughput limits
- recovery patterns
- operational health
Scatter charts show variation.
CFDs show stability.
Together, they give you a complete picture of your fulfillment flow.
FillSpeed brings this level of flow intelligence — once available only to large e‑commerce companies — to Shopify merchants.