Lesson 12 — Using FillSpeed: Daily Operational Decision‑Making
Fulfillment intelligence is only valuable if it drives better daily decisions.
FillSpeed is designed to give merchants the same real‑time operational visibility that top e‑commerce companies rely on — but in a simple, intuitive interface.
This lesson explains how to use each FillSpeed tool to make fast, confident, daily operational decisions.
The layout of FillSpeed App's pages are shown below. In the rest of this lesson, we will go through each page to understand how to use them.
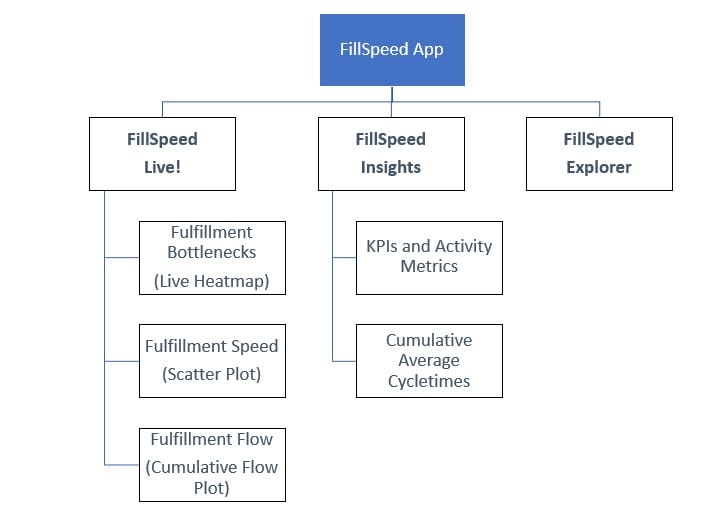
FillSpeed Live Page
The Live page is your real‑time command center.
It shows what is happening right now across your entire fulfillment operation — from warehouse stages to carrier movement.
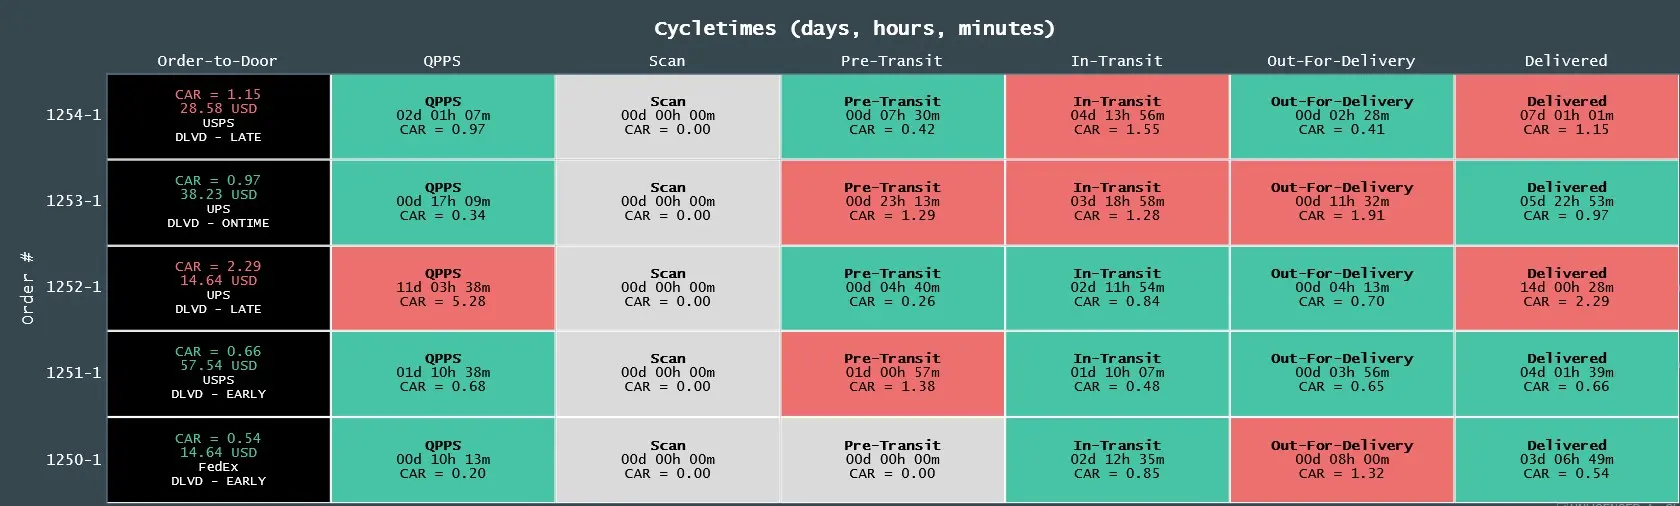
1. Heatmap — Real‑Time Bottleneck Detection
What the Heatmap Shows
- Every order currently in fulfillment
- The stage each order is in
- The CAR (Cumulative Average Ratio) for each order
- Color‑coded signals showing stress or delay
- Bottlenecks across warehouse stages and carrier stages
The heatmap is your live “flow radar.”
Daily Operational Decision‑Making
Use the heatmap to:
- Identify which stage is slowing down right now
- Reassign staff to overloaded stages
- Break batching behavior when CAR spikes
- Detect inventory issues (Pick stage delays)
- Detect packing or labeling slowdowns
- Detect missed or at‑risk carrier pickups
- Spot carrier delays (Pre‑Transit or In‑Transit spikes)
The heatmap tells you where to act immediately.
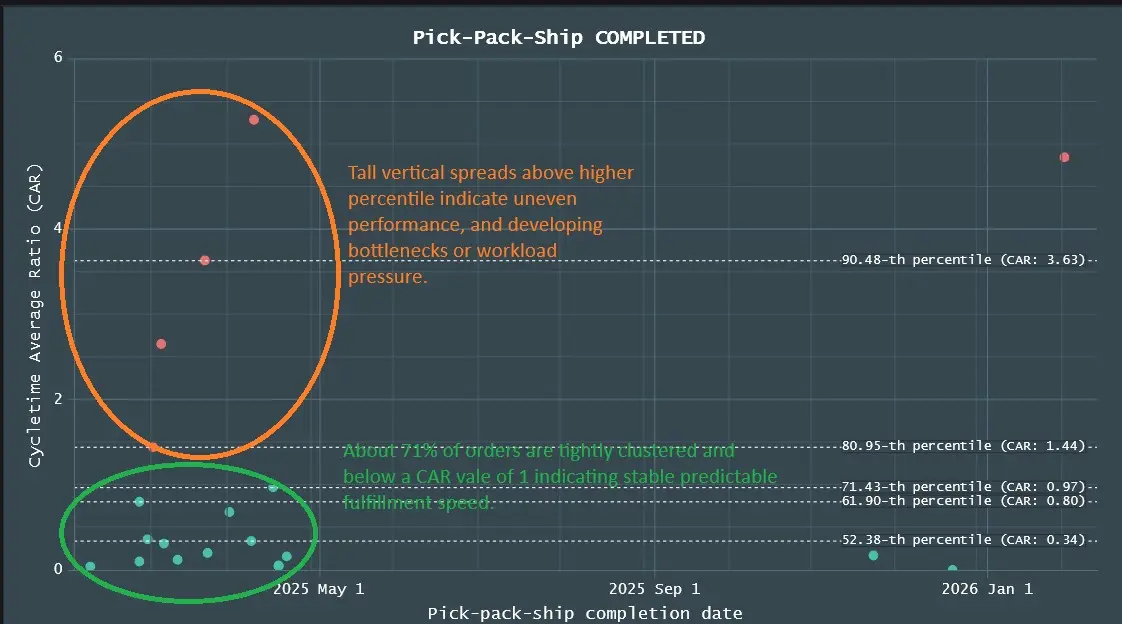
2. Scatter Plot — Variation, Drift, and Stress Patterns
What the Scatter Plot Shows
- Each point = one order’s cycle time or CAR
- Distribution of performance across time
- Clusters, spikes, and drift
- Percentiles (50th, 75th, 90th, 95th)
- Outliers and instability
Scatter plots reveal the texture of your flow.
Daily Operational Decision‑Making
Use the scatter plot to:
- Detect rising variation (early sign of instability)
- Identify operator or station variability
- Spot time‑of‑day patterns (morning spikes, afternoon slowdowns)
- Detect batching behavior
- Confirm whether yesterday’s issues are resolved
- Validate whether process changes improved stability
Scatter plots tell you how stable your flow is.
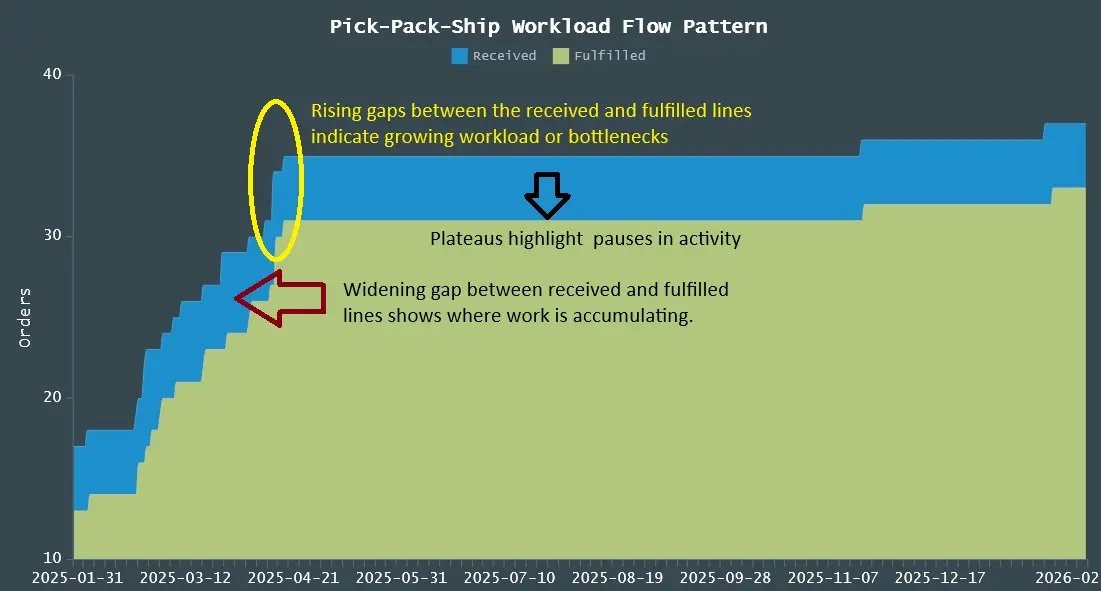
3. Cumulative Flow Plot (CFD) — WIP, Throughput, and Flow Stability
What the CumFlow Plot Shows
- Orders received vs. orders fulfilled
- WIP (Work in Progress) at each stage
- Throughput over time
- Flow stability or instability
- Bottleneck formation
- Recovery patterns
- Little’s Law in action (WIP = Throughput × Cycle Time)
CFDs reveal the shape of your flow.
Daily Operational Decision‑Making
Use the CFD to:
- See if WIP is rising (danger) or falling (recovery)
- Detect bottlenecks forming before they explode
- Confirm whether throughput is keeping up with demand
- Understand whether delays are internal or carrier‑related
- Validate staffing levels
- Plan for peak periods
CFDs tell you whether your system is stable.
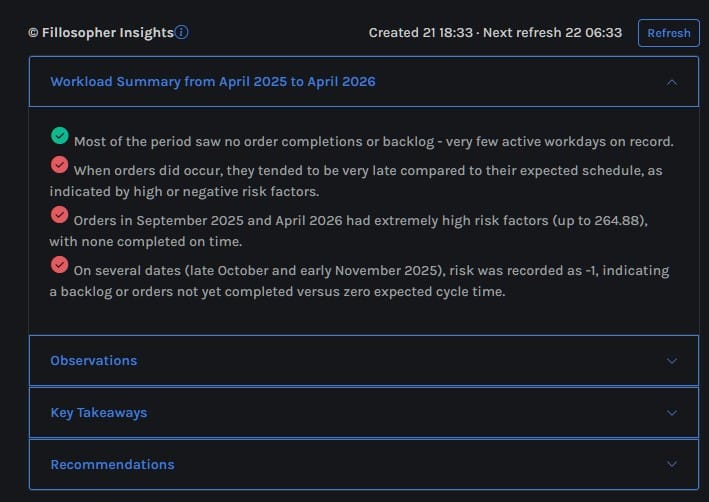
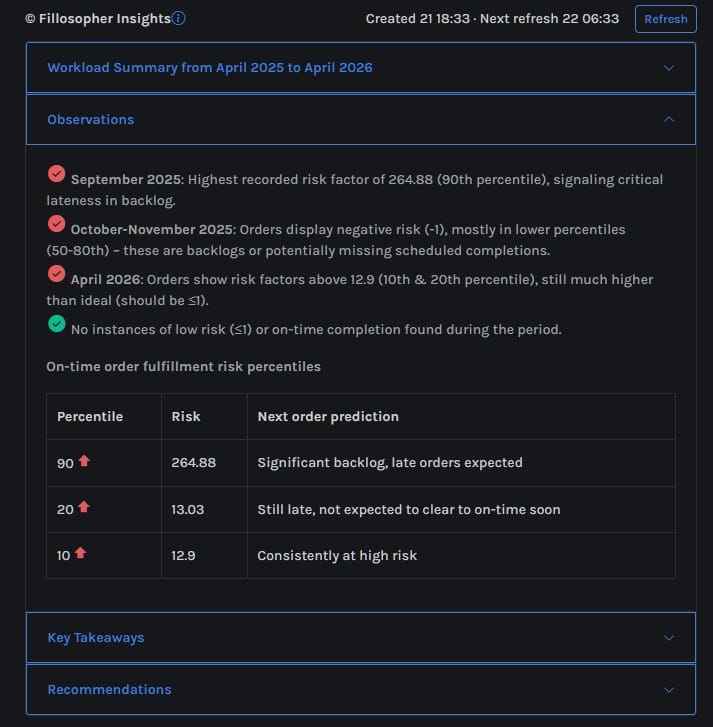
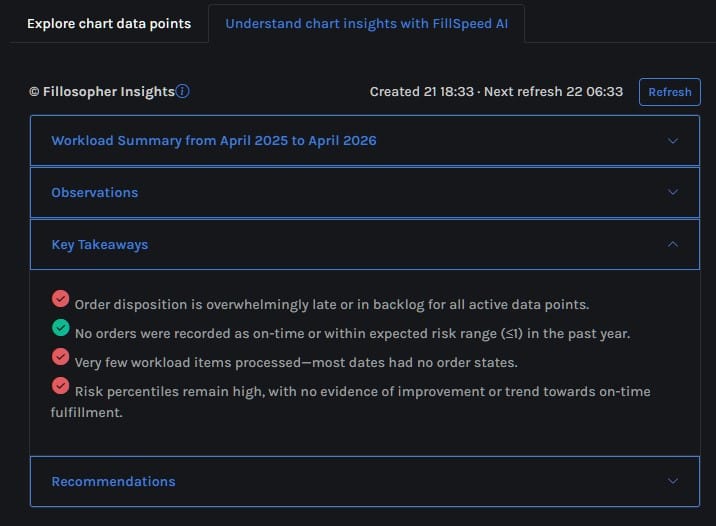
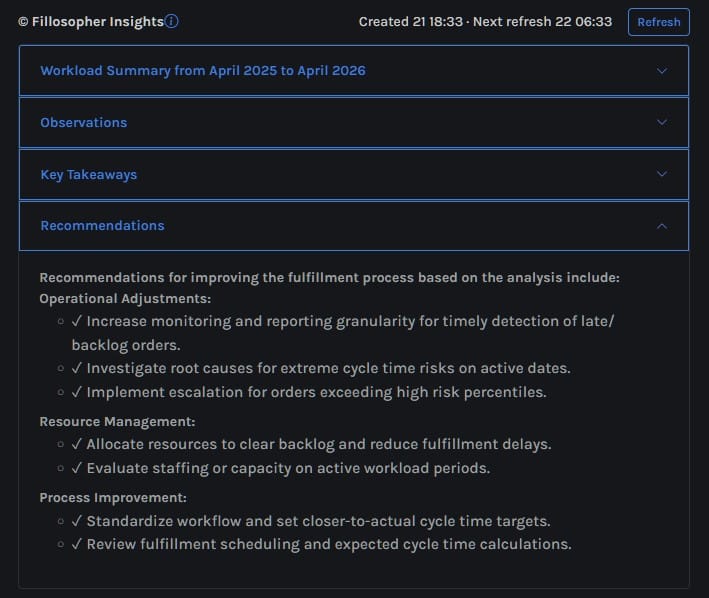
4. Fillosopher — Your AI Fulfillment Analyst
Fillosopher is the the AI operational analyst inside FillSpeed. It reads your current scatter or cumulative flow chart and highlights the key patterns, bottlenecks, and workload shifts happening in your fulfillment flow.
Fillosopher analyzes:
- scatter plot patterns
- cumulative flow shapes
- cycle‑time drift
- bottleneck formation
- delivery‑promise risk
Fillosopher produces:
- summaries
- observations
- key insights
- recommendations
All based on the current chart in view. The following is an example of Fillosopher insights for a scatter chart: for a specific period:
Daily Operational Decision‑Making
Use Fillosopher to:
- Understand what the charts are telling you
- Identify root causes of delays
- Get recommendations for immediate action
- Detect early warning signs
- Communicate issues to your team
- Make decisions faster and with more confidence
Fillosopher is your AI operations analyst, always on, always watching.
FillSpeed Insights Page
The Insights page shows your performance over time — not just what’s happening today.
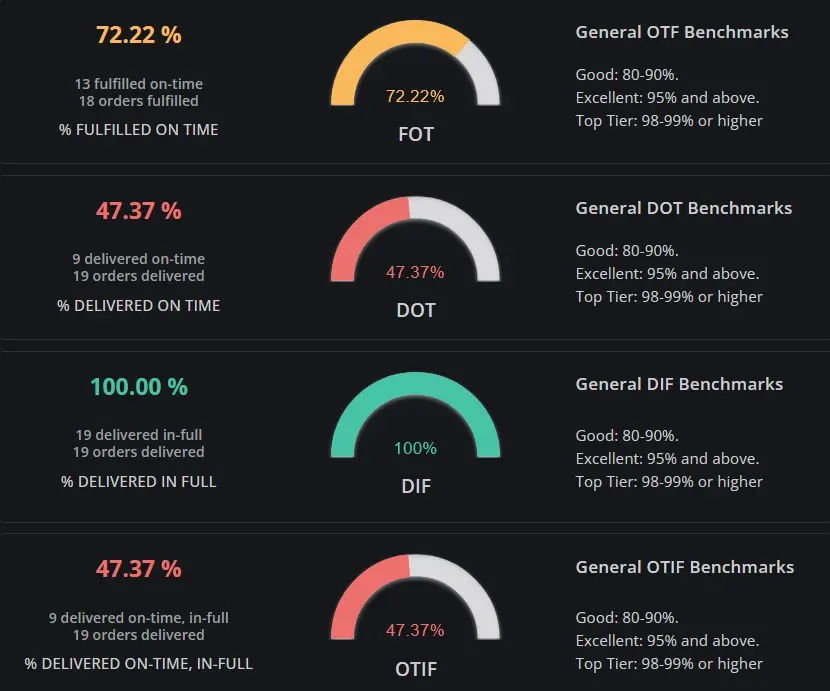
5. KPI Dials — Your Performance Dashboard
What the KPI Dials Show
- FOT (Fulfilled On Time)
- DOT (Delivered On Time)
- DIF (Delivered In Full)
- OTIF (On Time In Full)
- Trend indicators (up, down, stable)
These KPIs reflect customer‑visible performance.
Daily Operational Decision‑Making
Use the KPI dials to:
- Confirm whether you met yesterday’s ship‑by promises
- Detect rising internal delays (FOT drop)
- Detect carrier issues (DOT drop)
- Detect accuracy issues (DIF drop)
- Detect customer‑experience risk (OTIF drop)
- Prioritize which part of the operation needs attention today
KPI dials tell you how well you performed.
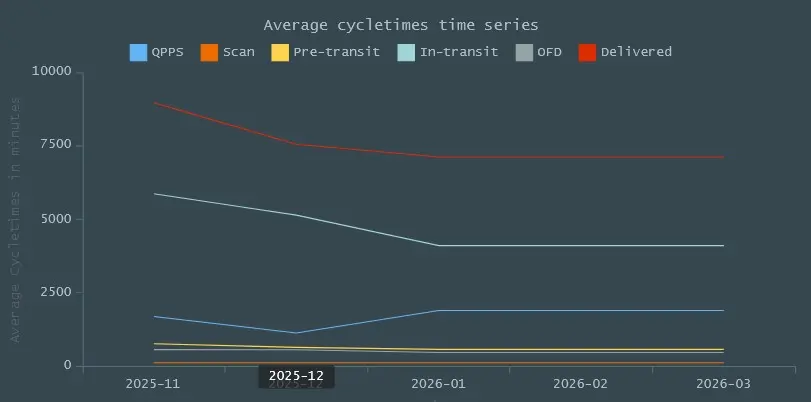
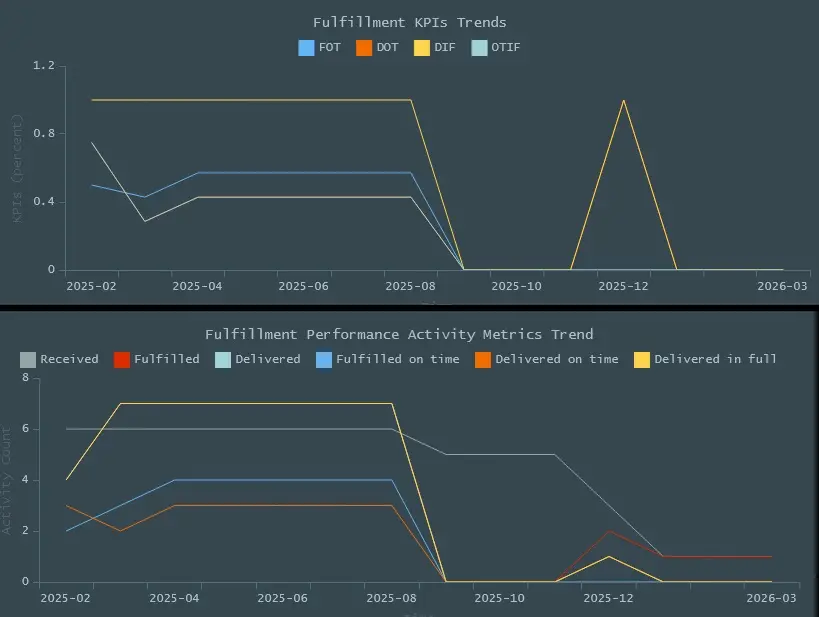
6. Moving Averages Timeline — Trend and Drift Detection
What the Timeline Shows
- Daily cycle‑time averages
- 7‑day moving averages
- 30‑day moving averages
- Trendlines for each KPI
- Drift, seasonality, and recovery patterns
Moving averages reveal long‑term performance.
Daily Operational Decision‑Making
Use the timeline to:
- Detect slow drift in cycle time
- Confirm whether process changes are working
- Identify seasonal or weekly patterns
- Predict staffing needs
- Understand whether issues are temporary or structural
Moving averages tell you where your operation is heading.
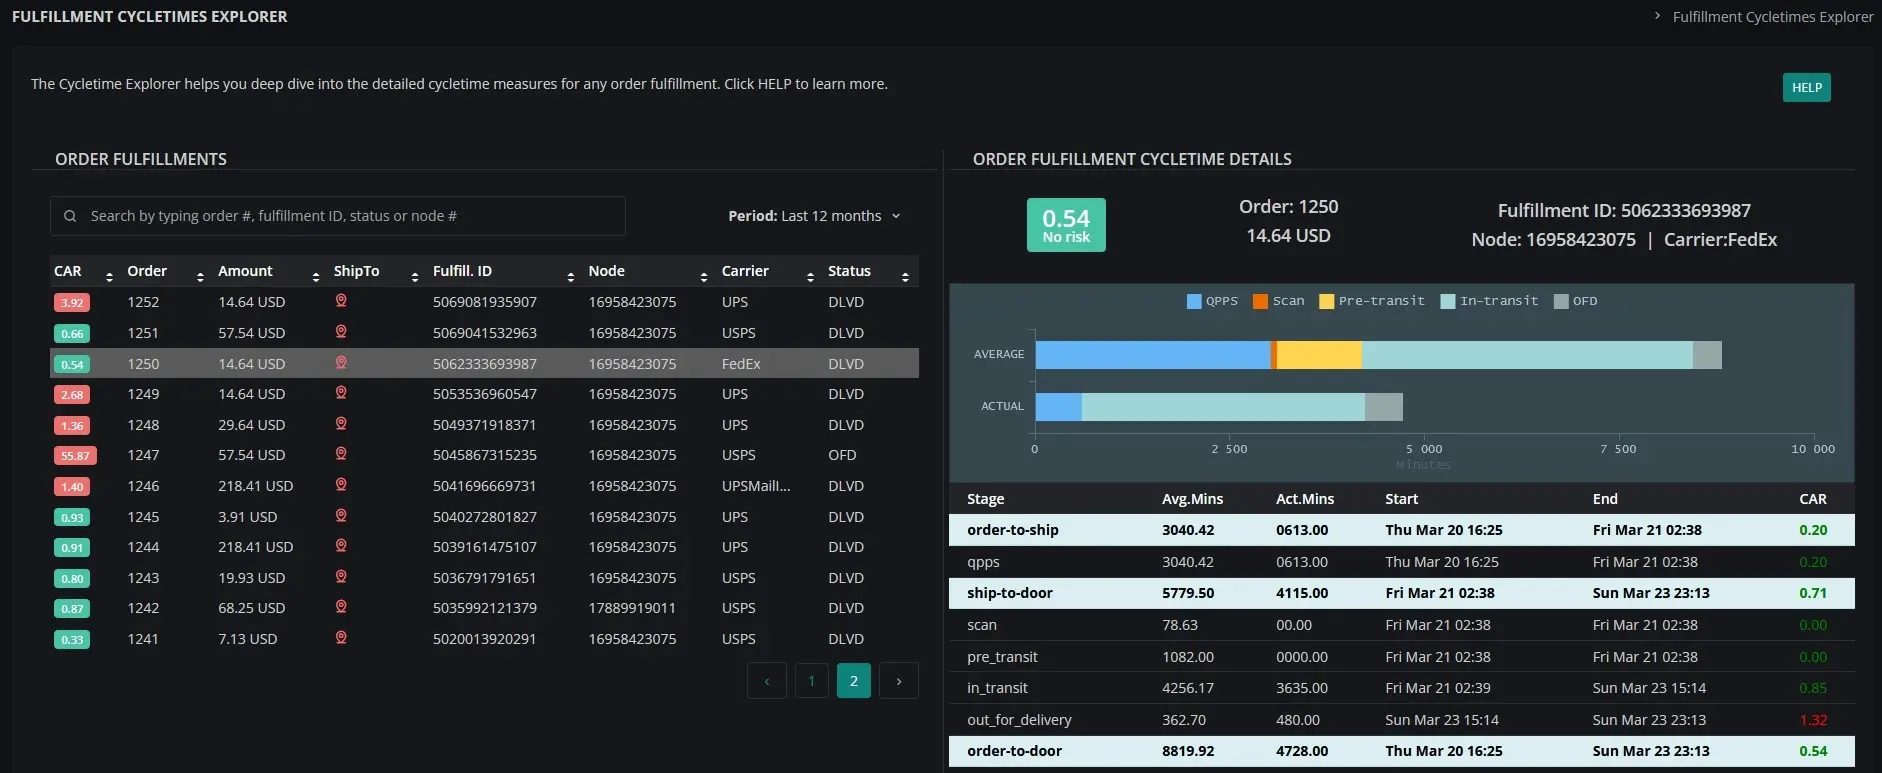
FillSpeed Explorer Page
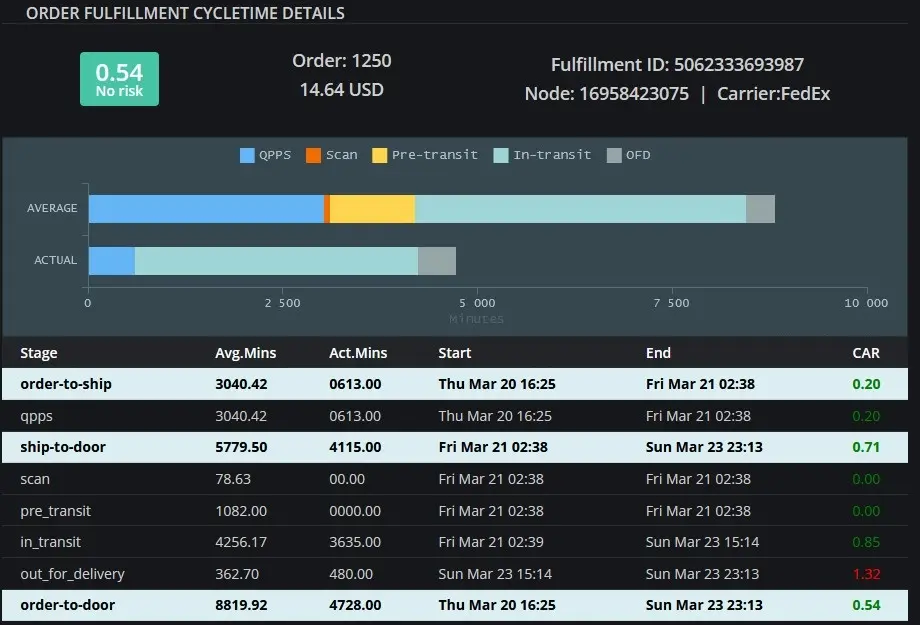
7. FillSpeed Explorer — Deep Cycle‑Time Investigation
What Explorer Shows
- Full cycle‑time breakdown for any order
- Stage‑level timestamps
- Stage‑level cycle times
- CAR values for each stage
- Carrier movement history
- Delivery‑promise performance
Explorer is your investigation tool.
Daily Operational Decision‑Making
Use Explorer to:
- Investigate customer complaints
- Diagnose outliers
- Understand why an order was delayed
- Identify root causes of FOT or DOT failures
- Train staff using real examples
- Validate whether a bottleneck is systemic or isolated
Explorer tells you why something happened.
Why This Lesson Matters
FillSpeed is not just a dashboard — it is a daily operational decision system.
- The Heatmap shows where to act right now.
- The Scatter Plot shows how stable your flow is.
- The CumFlow Plot shows whether your system is balanced.
- Fillosopher explains what the charts mean.
- The KPI Dials show how well you performed.
- The Moving Averages Timeline shows where you’re trending.
- The Explorer shows why delays happened.
Together, these tools give Shopify merchants the same operational intelligence that large e‑commerce companies use to run fast, stable, predictable fulfillment operations.