Lesson 6 — How FillSpeed Measures and Monitors Cycle Time
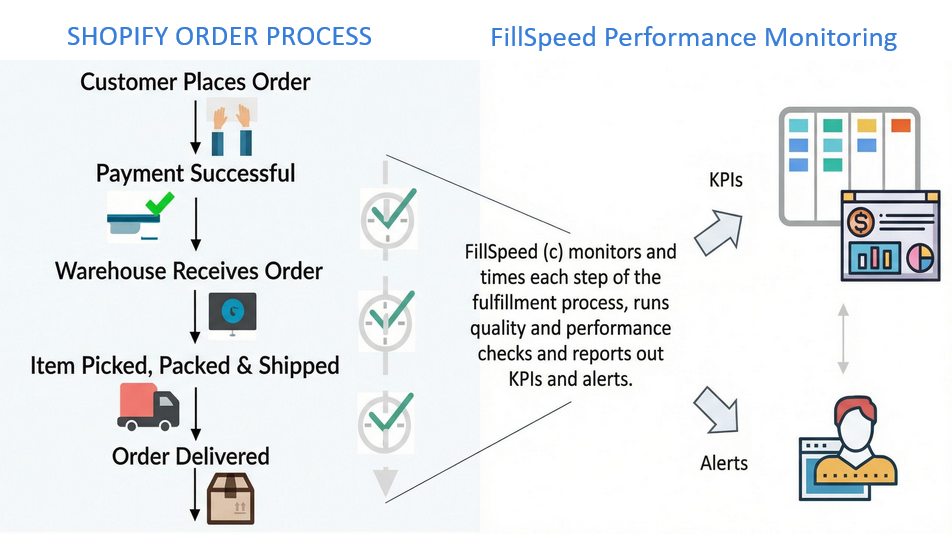
Cycle time is the heartbeat of fulfillment — but only if you can measure it continuously. Historically, merchants could not. Cycle‑time measurement was manual, slow, expensive, and done only a few times a year. FillSpeed changes that completely.
FillSpeed turns every order into a real‑time data source, giving merchants the same operational intelligence that top e‑commerce companies rely on.
This lesson explains how FillSpeed measures cycle time, how it builds your long‑term baseline, and how it visualizes bottlenecks across your entire fulfillment process.
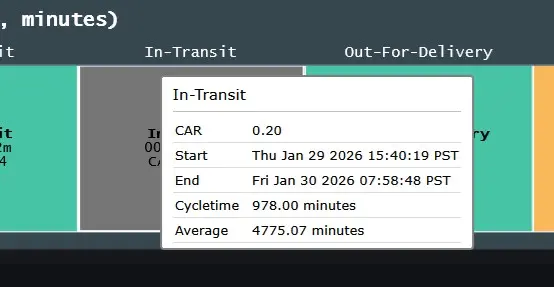
1. Real‑Time Virtual Timers for Every Order
FillSpeed creates hundreds of virtual stop watches or timers— one for every order currently in fulfillment.
Each virtual timer tracks:
- when a stage starts
- when a stage ends
- how long the stage took
- how the order compares to your long‑term average
These virtual timers run continuously across all stages:
- In‑Queue
- Pick
- Pack
- Ship
- Pre‑Transit
- In‑Transit
- Out‑for‑Delivery
This gives you a live, second‑by‑second view of your entire operation.
2. Stage‑Level Cycle Times: The Building Blocks of Flow Intelligence
For each order, FillSpeed measures:
Cycle Time = End Timestamp – Start Timestamp
This creates:
- In‑Queue Cycle Time
- Pick Cycle Time
- Pack Cycle Time
- Ship Cycle Time
- Pre‑Transit Cycle Time
- In‑Transit Cycle Time
- Out‑for‑Delivery Cycle Time
- Total Order Cycle Time
These stage‑level cycle times are the foundation for understanding flow, bottlenecks, and delivery‑promise risk.
3. Cumulative Averages: Your True Operational Baseline
What is a cumulative average?
A cumulative average is the average cycle time for a stage across all completed orders. It updates continuously as more orders are delivered.
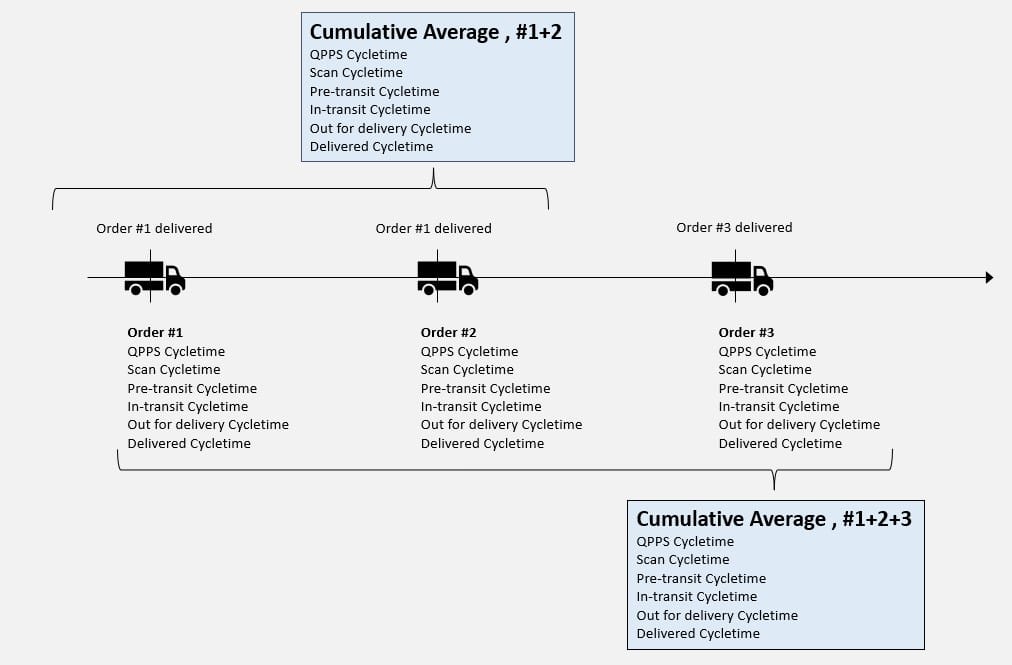
Why cumulative averages matter
- They represent your real fulfillment capability.
- They smooth out noise and reveal long‑term performance.
- They adapt as your operation evolves.
- They become the baseline for evaluating every new order.
This is your operational “resting heart rate.”
4. CAR — Cumulative Average Ratio (Your Operational A1C)
What is CAR?
CAR =
Order’s Stage Cycle Time ÷ Cumulative Average for That Stage
What CAR tells you
- CAR < 1 → Faster than your long‑term average
- CAR = 1 → On pace
- CAR > 1 → Slower than your long‑term average
Why CAR matters
CAR shows variance — how far each order deviates from your baseline.
Variance reveals:
- bottlenecks
- stress periods
- operator overload
- inventory issues
- carrier delays
- flow instability
CAR is the fulfillment equivalent of an A1C score — a measure of long‑term health and short‑term drift.
5. Real‑Time Heatmap: Your Live Bottleneck Dashboard
FillSpeed displays all active orders in a color‑coded heatmap.
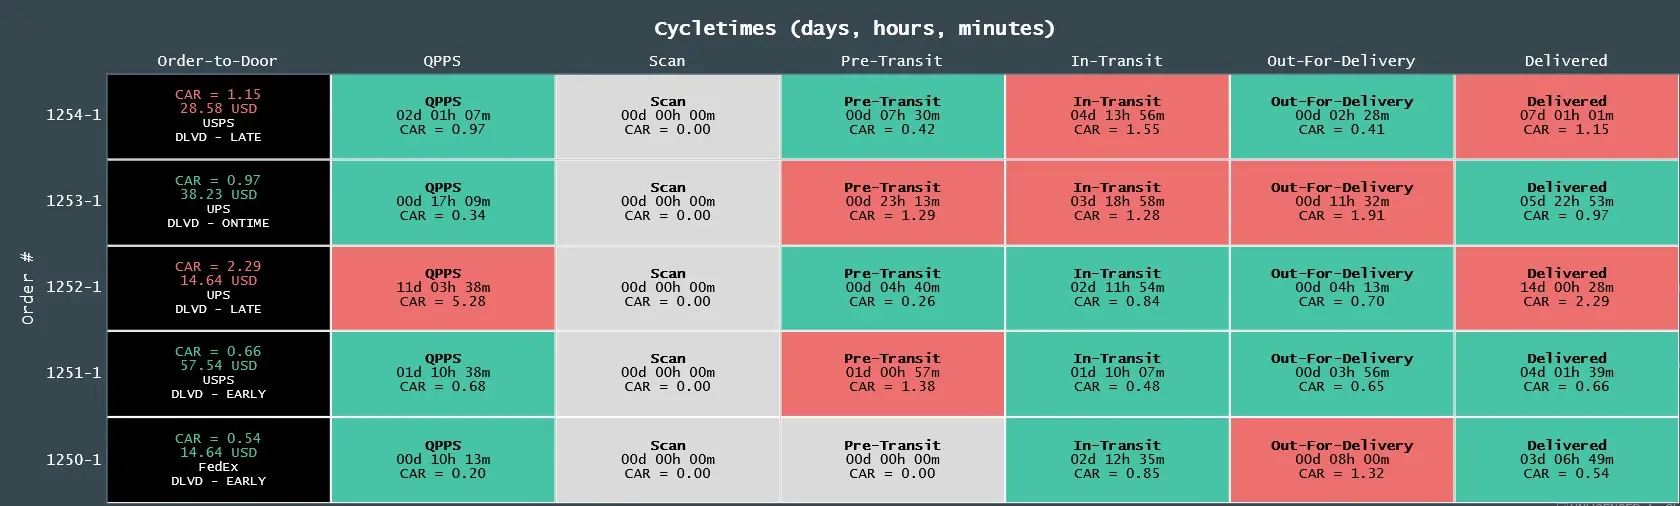
What the heatmap shows
- Every order currently in fulfillment
- The stage each order is in
- The CAR value for each order
- Color signals for stress or delay
What the heatmap reveals
- Where bottlenecks are forming
- Which stages are overloaded
- Whether delays are internal or carrier‑related
- Whether flow is stable or breaking down
Why the heatmap matters
It gives supervisors a live, actionable view of the entire operation — something that previously required analysts, consultants, and weeks of manual work.
6. Why This Lesson Matters
FillSpeed doesn’t just measure cycle time — it transforms it into a living, breathing operational intelligence system.
This lesson sets the foundation for:
- Scatter charts (variation over time)
- Cumulative flow diagrams (WIP and throughput)
- KPI interpretation (OTIF, DOT, DIF)
- Daily operational decision‑making
Cycle time is the signal.
FillSpeed is the monitor.